
Account Overview
The first page shows an overview of the accounts for various TV metrics and analytics.
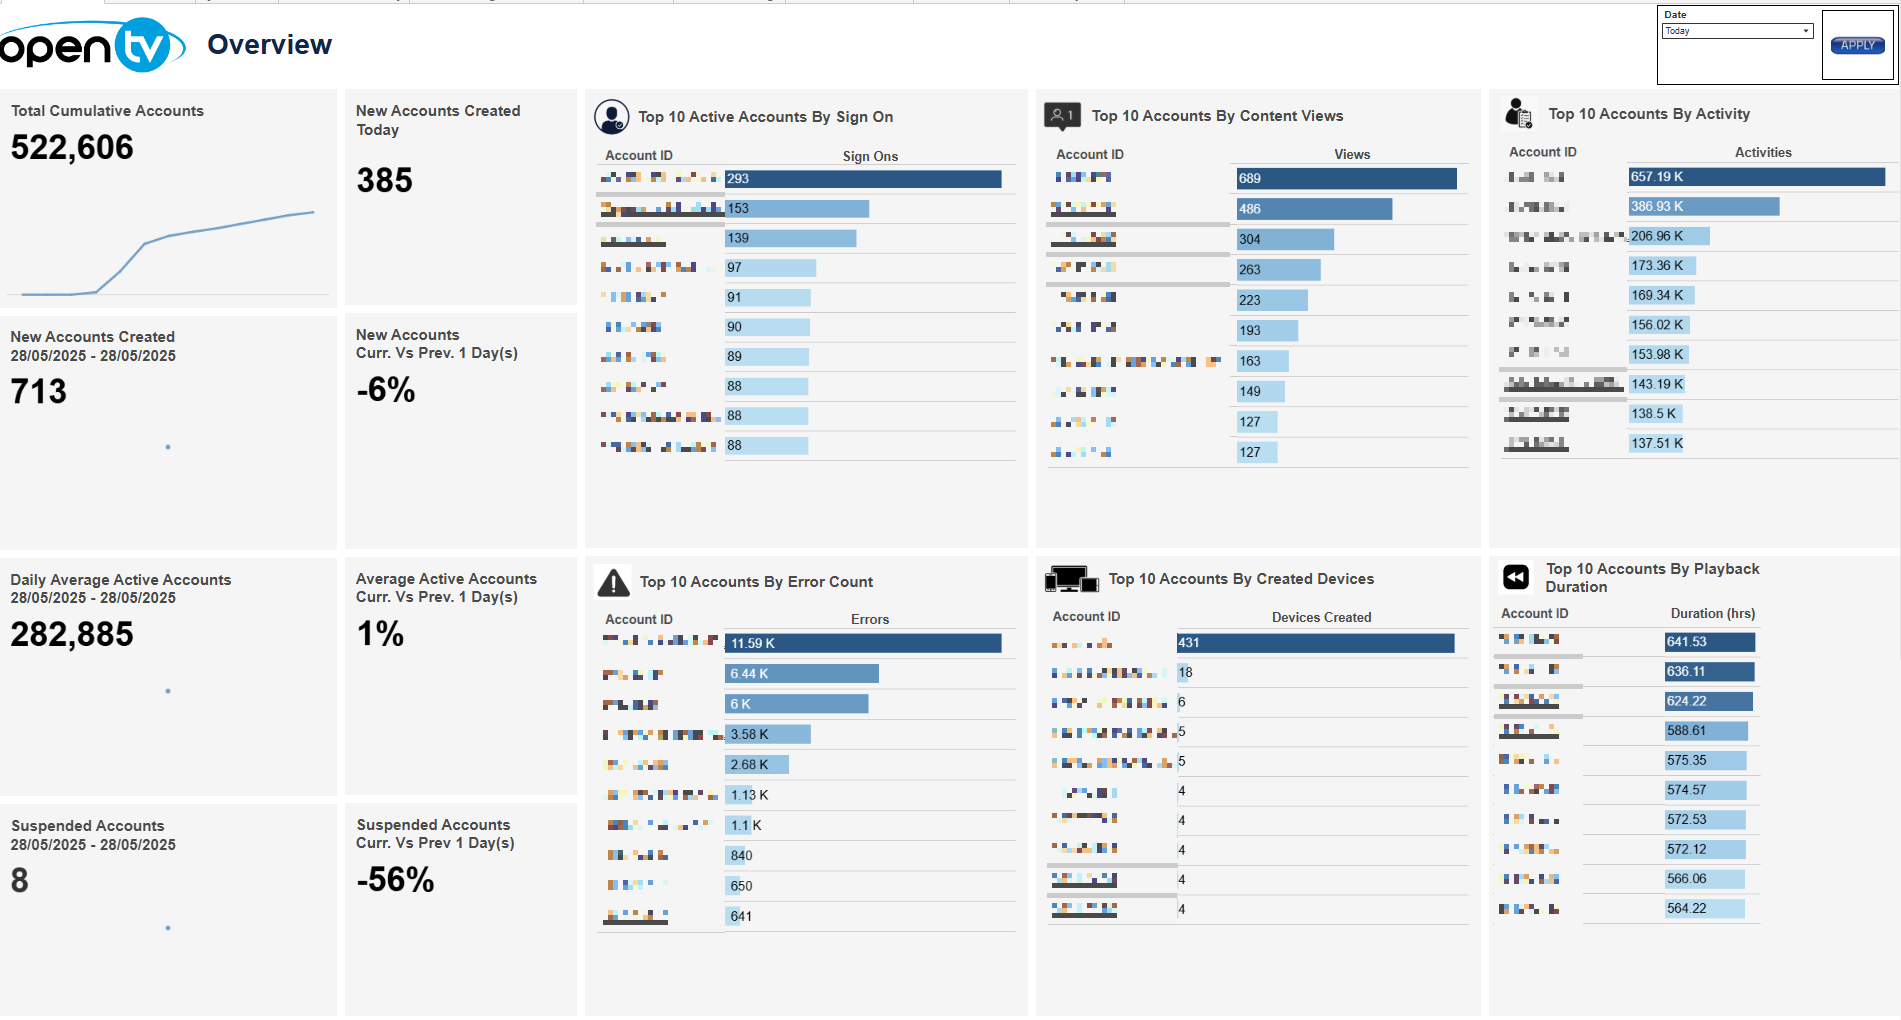
The top right of the page shows a Date drop-down menu, with preset time intervals for Today, Yesterday, Last 7 days, Last 14 days, and Last 30 days. Selecting one of these options then clicking Apply loads the data.
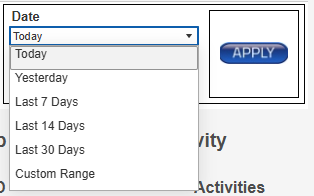
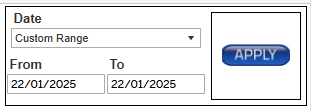
Users can also select Custom Range, which causes the From and To date fields to appear below, and allows users to specify any time interval. Users must then click Apply to load the data.
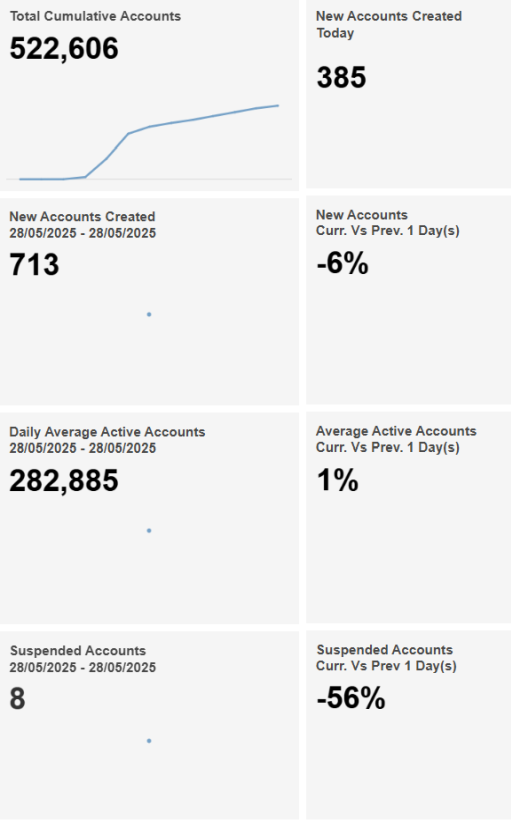
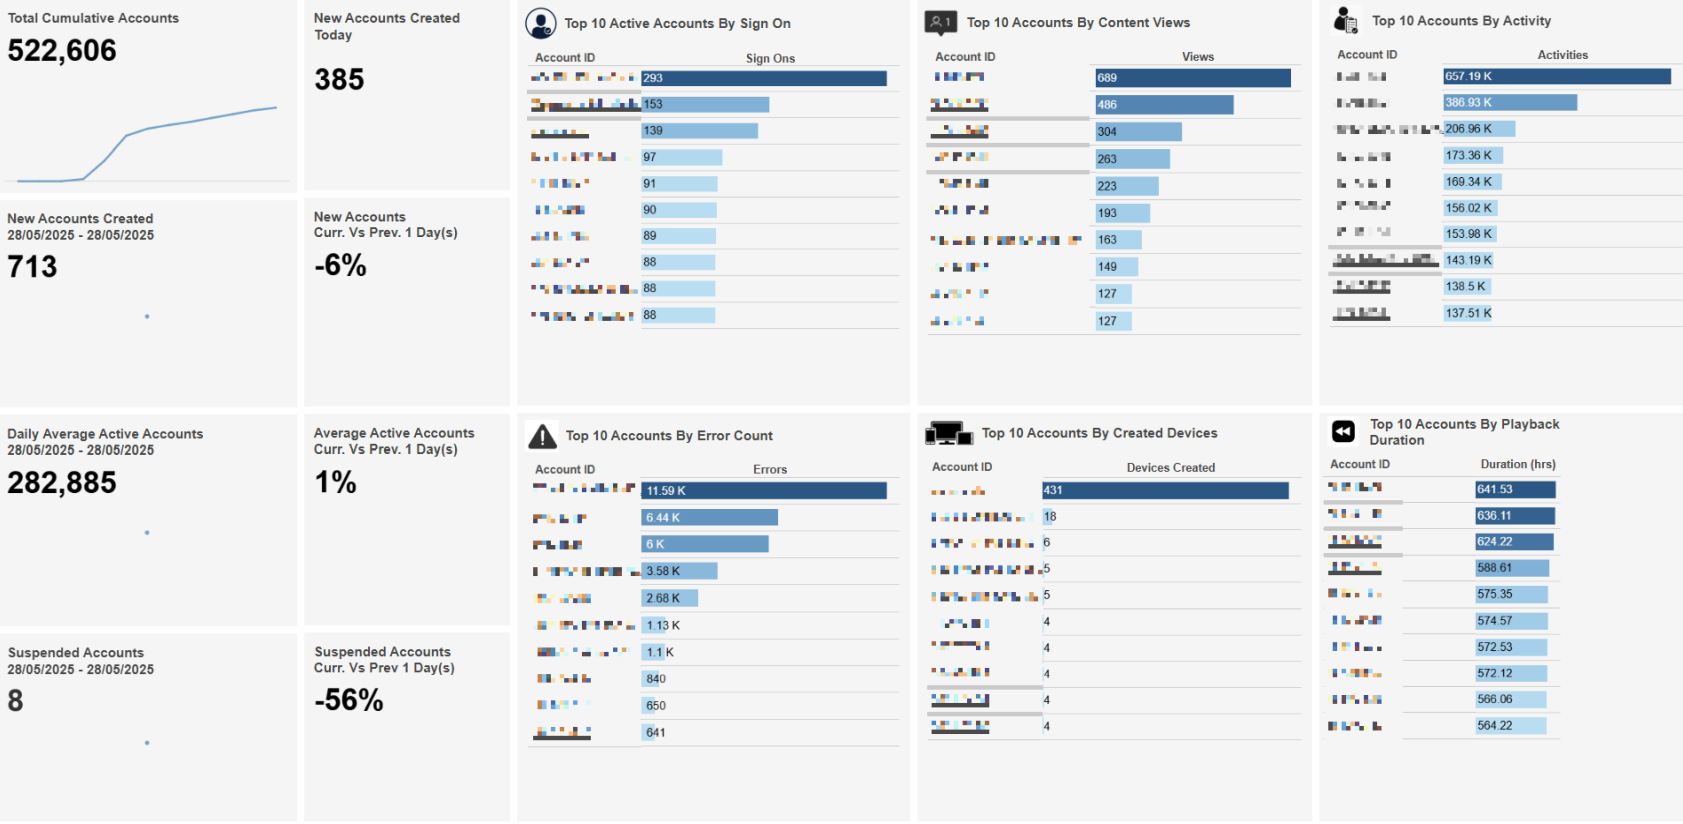
On the left side of the page, the report shows sheets for Total Cumulative Accounts, New Accounts Created Today, New Accounts Created, New Accounts Curr Vs Prev, Daily Average Active Accounts, Average Active Accounts Curr Vs Prev, Suspended Accounts and Suspended Accounts Curr Vs Prev. The mouseover tooltips on each sheet give further information.
To the right of these sheets, the report shows tables for the overall metrics. These are Top 10 Active Accounts By Sign On, Top 10 Accounts By Content Views, Top 10 Accounts By Activity. Top 10 Accounts By Error Count, Top 10 Accounts By Created Devices and Top 10 Accounts By Playback Duration. The mouseover tooltips on each bar give further information.
Single-clicking an Account ID or blue bar in any table highlights the row and triggers a drill-down to the Account Details page where more detailed information for the selected account is shown.