Logging
To test this feature and view the example code, please see the Browsers and Connected TV SDK 5 Example Code Quick Start guide.
The Player SDK can report increasingly detailed levels of diagnostic logging when viewing the browser Developer Tools feature or when attached with the Developer Tools to a supported Connected TV platform. However, when the Developer Tools are unavailable, this log information can also be made available to a callback function. This approach can be used if you want to provide a custom way to extract debug information in an environment where a specific issue needs investigating with a small set of users of devices for a short time. For example, if a production environment Smart TV is experiencing an issue and the Developer Tools are unavailable, you may want to capture logging output to the screen.
The code snippets below show an example of how a logging pane DOM element can display the logs generated by the page using the API to register a callback function.
	<div className="logPanel" id="log-panel">
		<textarea readonly rows="25" cols="150" name="comment" id="logWindow" form="usrform">
If enabled, logs will appear here
			</textarea>
</div>function registeredLogProvider(stuffToBeLogged) {
let logPane = document.getElementById("logWindow");
let previous = logPane.innerHTML;
logPane.innerHTML = `${previous}${stuffToBeLogged}`;
logPane.scrollTop = logPane.scrollHeight;
}
window.player.otvtoolkit().logProvider.setLogProvider({
logProvider: registeredLogProvider,
});The Log Provider code uses the console functions to capture and export text output to other destinations, an anti-pattern for a registeredLogProvider() function is as follows:
anti pattern
function registeredLogProvider(stuffToBeLogged) {
	// This will recurse and quickly crash
	console.log(stuffToBeLogged);
}
The following debug levels are used:
shaka.log.Level = {
	NONE: 0,
	ERROR: 1,
	WARNING: 2,
	INFO: 3,
	DEBUG: 4,
	V1: 5,
	V2: 6
};
By default, the INFO level of logging will be output to the console.
Adjusting the level
The log level can be adjusted programmatically using the setDebugLevel() API call. In this example, to display V2 (Very Verbose) logs use:
window.player.otvtoolkit().logProvider.setDebugLevel(6);Alternatively, when the Developer Tools console is available, use the following command to adjust the desired level of logging the SDK will output. For example, to display V2 (Very Verbose) logs enter:
shaka.log.setLevel(6)To stop all logs from being generated, enter:
shaka.log.setLevel(0)Managing logs in the Developer Tools
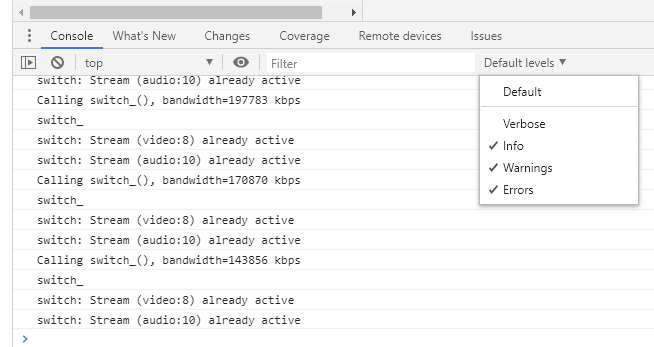
When viewing logs in the Developer Tools environment, the volume of log output can be controlled by the standard filtering options provided, such as that shown below with Chromium-based environments:

