
Diagnostics
The CONNECT Player SDK enables you to obtain two forms of diagnostics information while it is running; logging and error reporting.
Logging
When viewing the browser Developer Tools feature, or when attached with the Developer Tools to a supported Connected TV platform, the Player SDK can report increasingly detailed levels of diagnostic logging.
It is expected you would only do this when guided by NAGRA support engineers.
shaka.log.Level = {
	NONE: 0,
	ERROR: 1,
	WARNING: 2,
	INFO: 3,
	DEBUG: 4,
	V1: 5,
	V2: 6
};
By default, the INFO level of logging will be output to the console. The level is set back to the default on zap to a stream.
Adjusting the level
On the Developer Tools console, use the following command to adjust the desired level of logging the SDK will output. For example to display V2 (Very Verbose) logs enter:
shaka.log.setLevel(6)To stop all logs being generated enter:
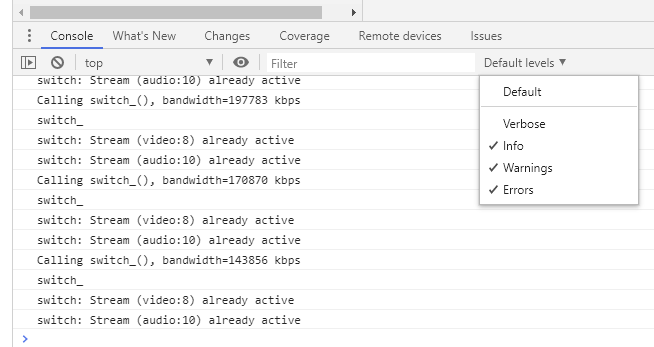
shaka.log.setLevel(0)The volume of log output can be controlled by the standard filtering options provided by the Developer Tools environment, such as that shown below with Chromium-based environments:
Error reporting
If required, errors can be reported from the SDK’s player engine to a listener function in your Application layer. The function signature needs to be as follows:
function onErrorCallback(
	errorSeverity,
	errorCategory,
	errorCode,
	errorMessage
) {
	// functionality to be implemented by the integrator
}
The listener function name should be passed to the SDK via a call through otvtoolkit to setErrorListener() on the exposed errorReporting component as follows:
window.player.otvtoolkit().errorReporting.setErrorListener({
	errorChanged: onErrorCallback
});